Improved
🗒️Add Notes to Your Line Charts
8 months ago by Adriano Toro
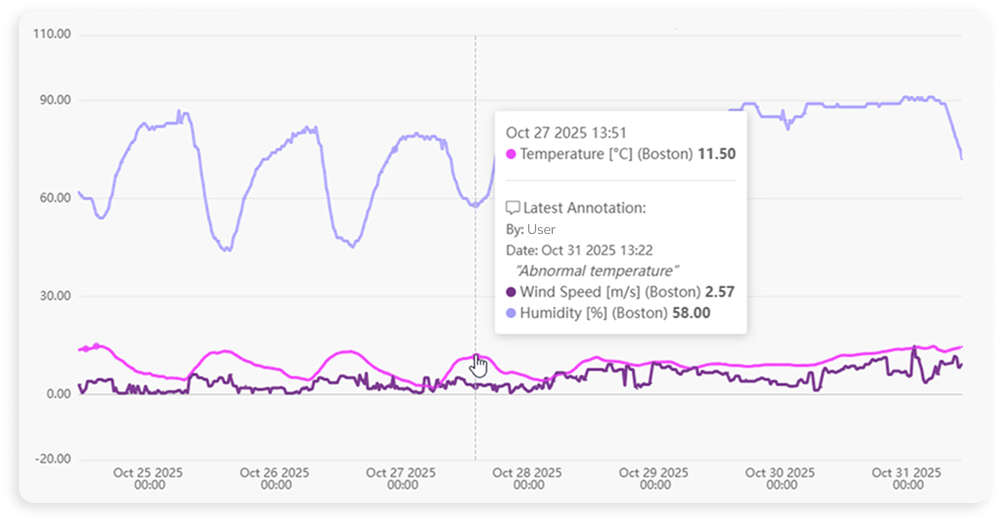
The Line Chart widget now supports annotations, allowing you to add notes directly to specific data points for added clarity and context. Whether you're marking an equipment failure, noting a manual override, or highlighting a spike in readings, these notes can be viewed instantly by hovering over the data point in the chart. It's a simple but powerful way to enrich your time series visuals with real-time insights, making your dashboards more informative and easier to interpret—especially when collaborating across teams.