📈Better Line Charts With Context Data
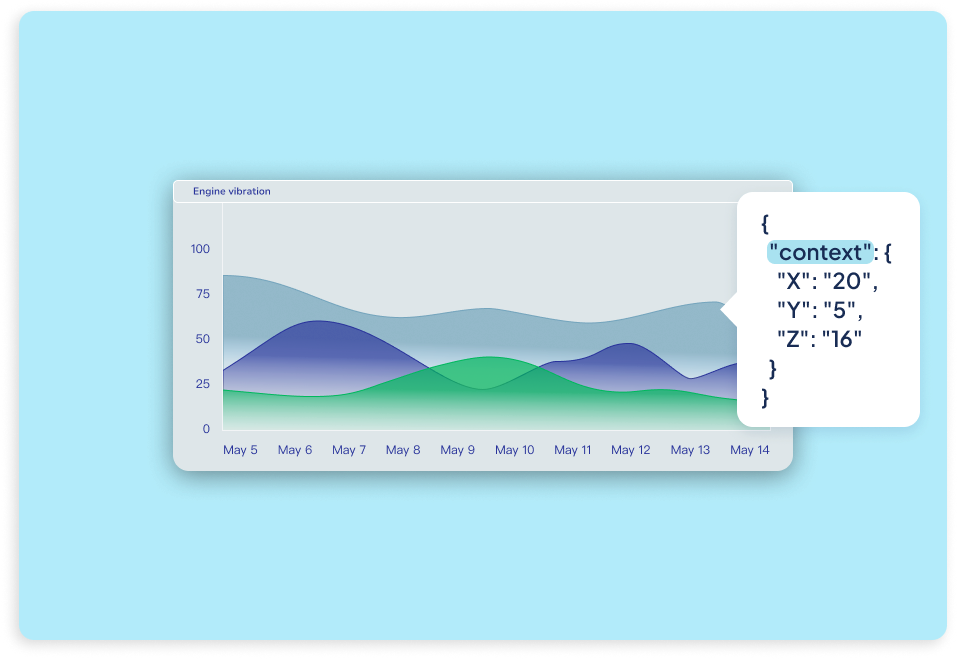
We've improved the Line Chart widget by introducing the option to have it work with context-based data, unlocking new ways to visualize rich, multidimensional measurements. You can now choose whether a line chart works from a variable’s value or from numeric fields stored inside its context, making it ideal for use cases like vibration analysis, frequency monitoring, or any scenario where multiple axes or related metrics are sent together in a single payload. This approach keeps measurements time-aligned, reduces dot usage, and delivers clearer insights without increasing data volume. Regardless of your application, context-aware Line Charts give you more flexibility to represent complex signals accurately, all while keeping dashboards clean, efficient, and easier to interpret.