📊 New plugin: Breakdown Bar Chart
about 2 years ago by Adriano Toro
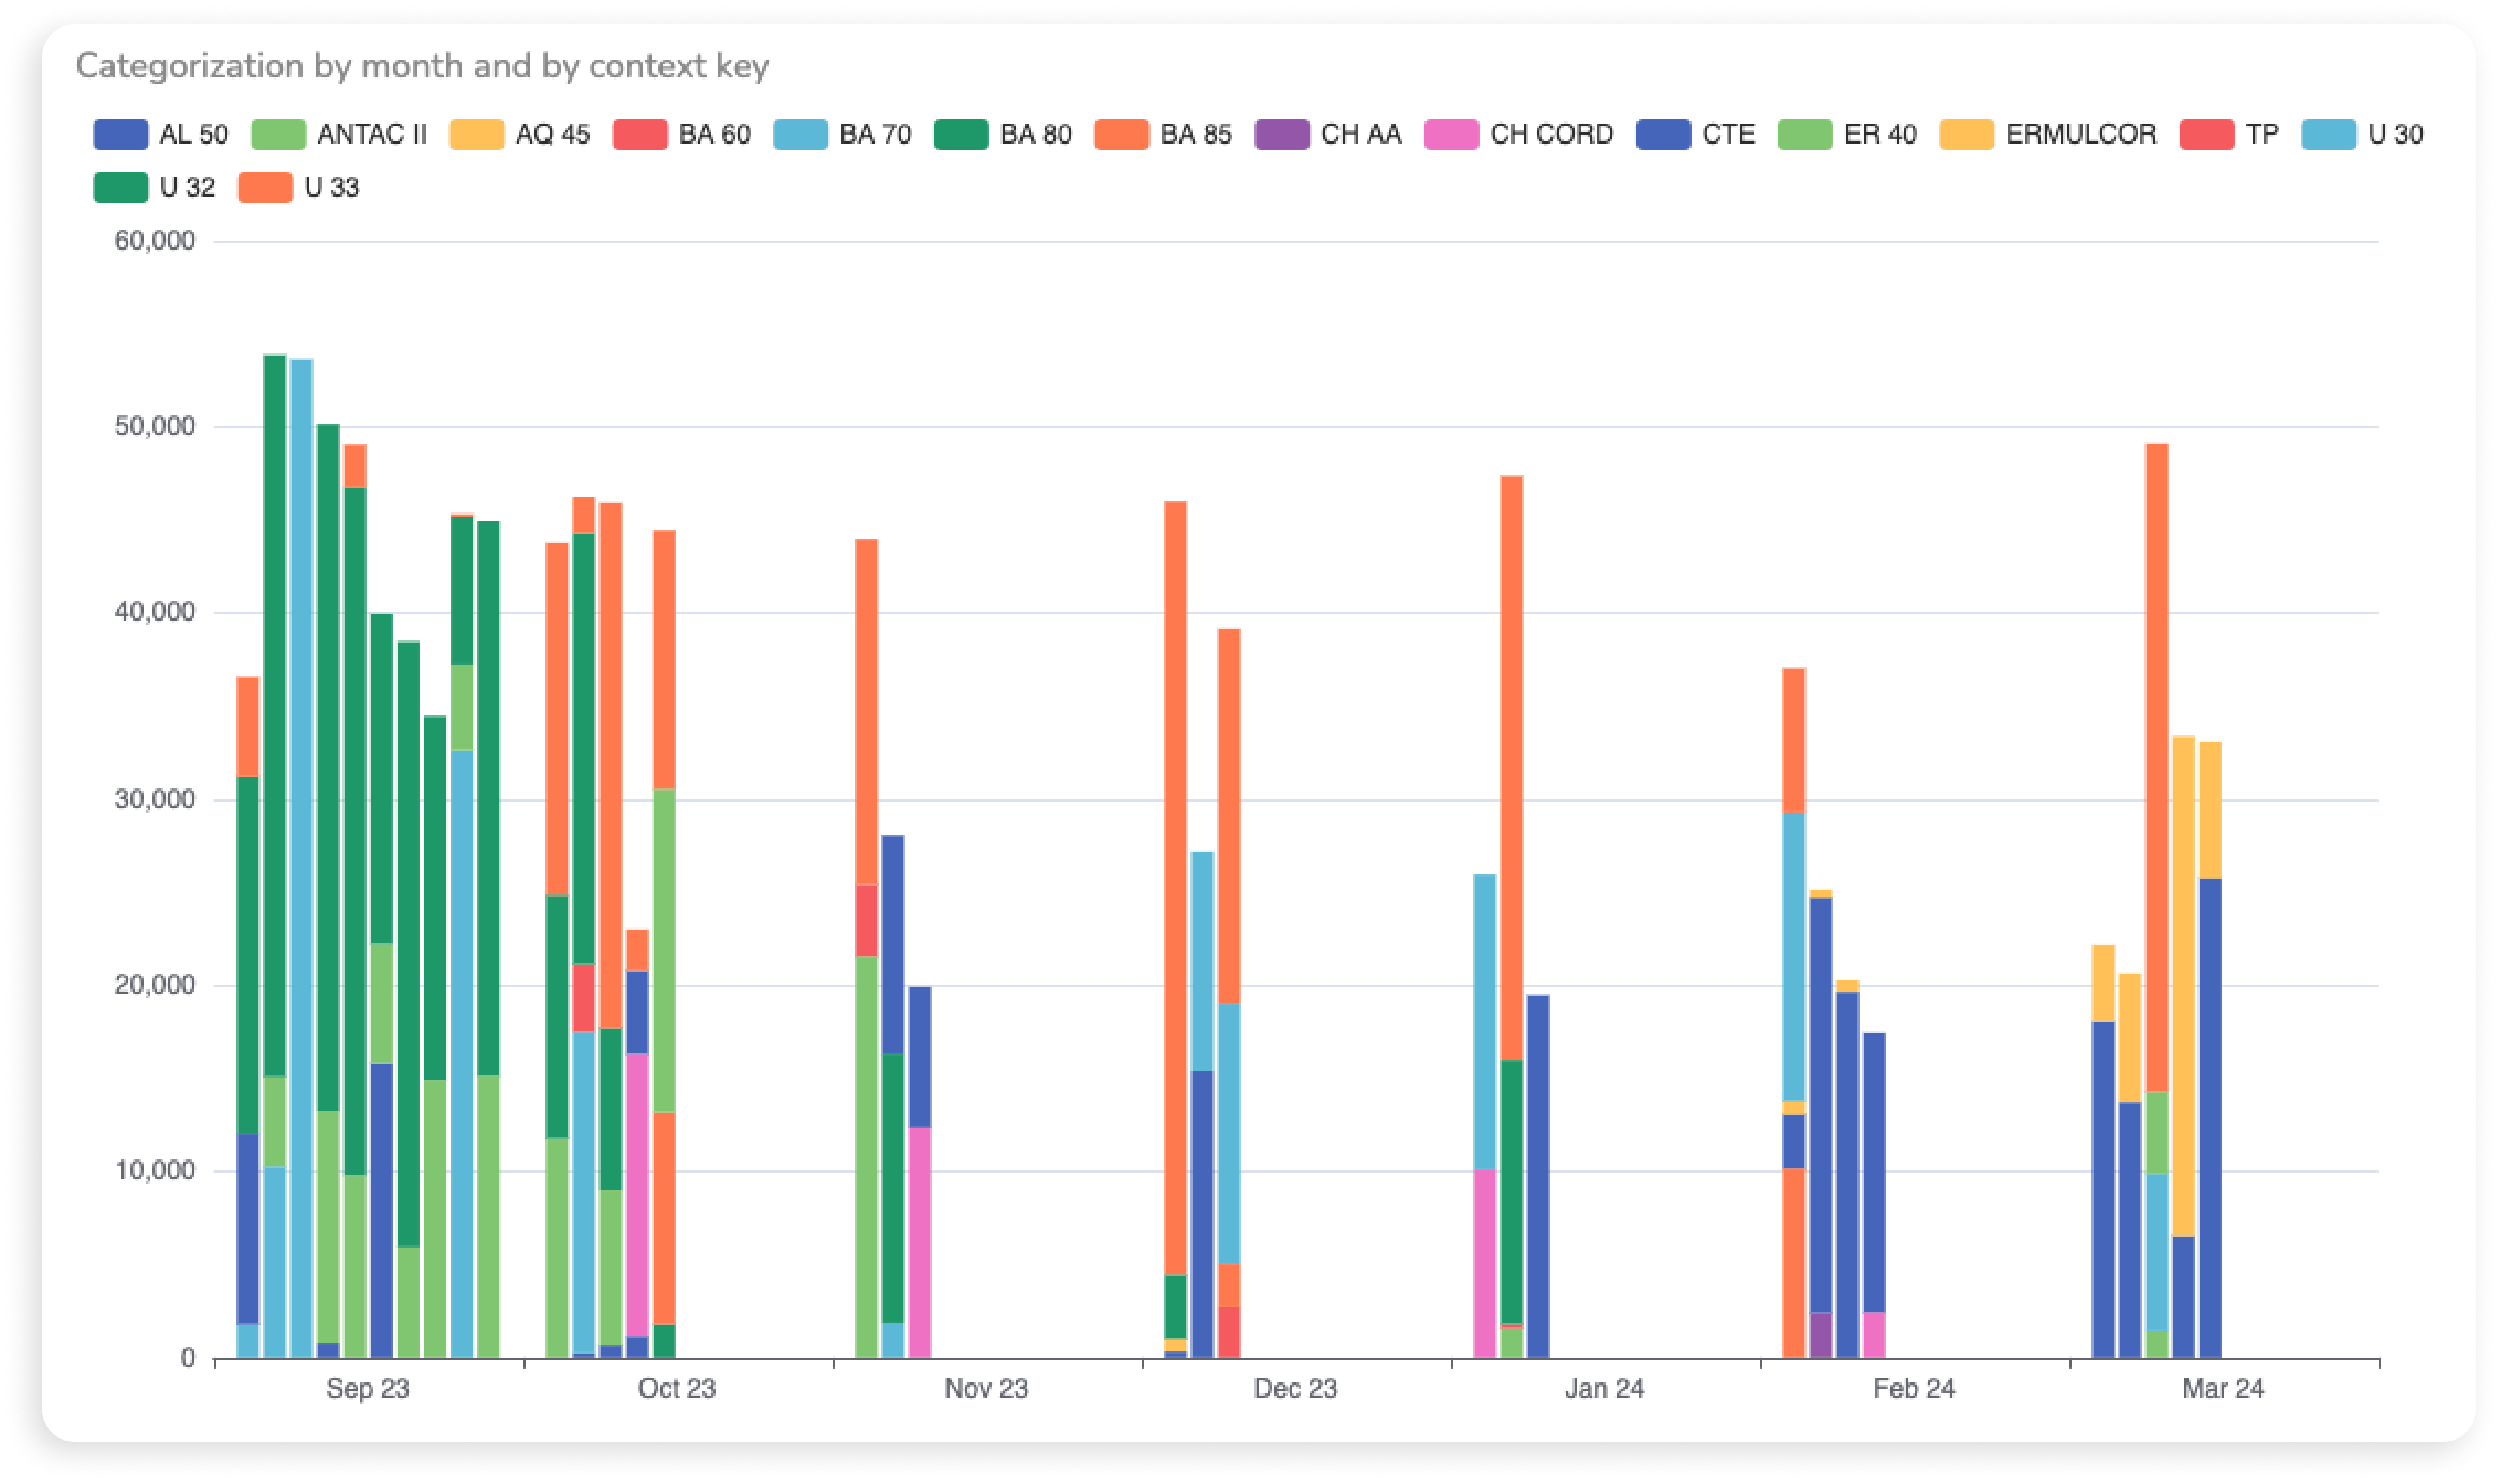
We’re happy to introduce the Breakdown Bar Chart, a plugin that offers a simple, yet powerful way to break down time-series data based on context, resulting in a bar chart that's always categorized by month within the dashboard's selected time range.
This can be useful in cases such as OEE measuring: By grouping the different causes of machine downtime through the dot’s context, you can swiftly spot operational patterns and improvement opportunities by figuring out which causes affect machines the most.