

Improved
🎨ECharts for the Gauge Widget
8 months ago by Adriano Toro
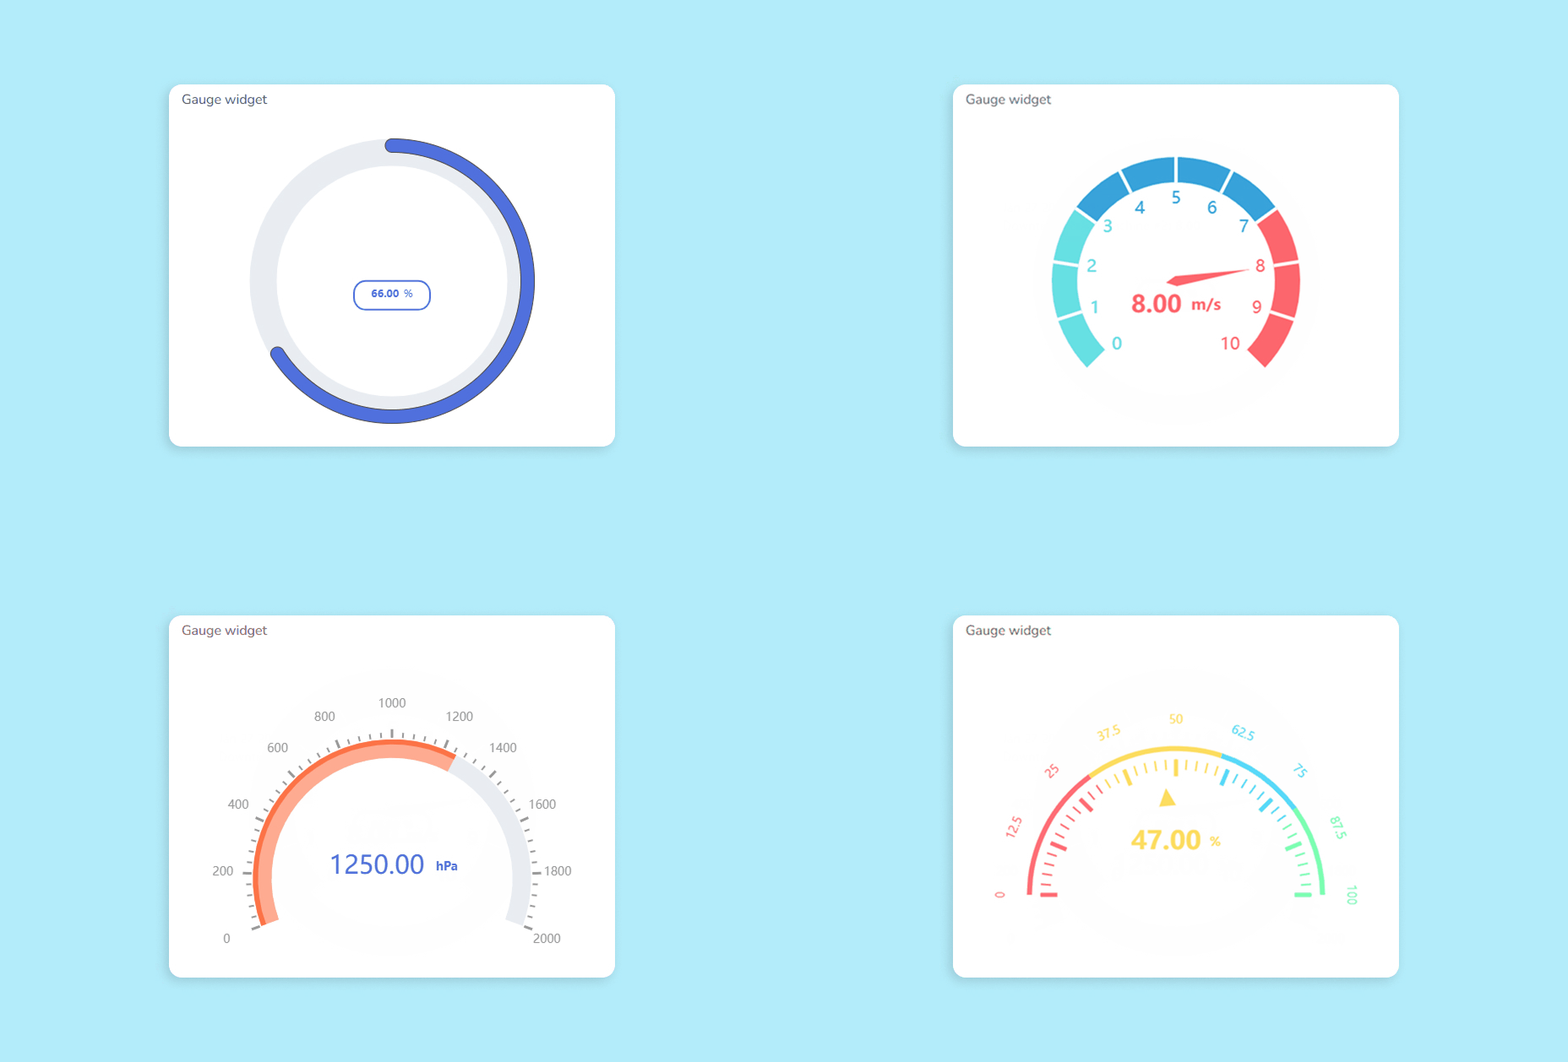
The Gauge widget just became significantly more flexible. It now supports ECharts configuration, unlocking a new level of control over how your gauges look and behave. Beyond the native settings, you can fine-tune visual details like angles, colors, ticks, labels, pointers, and much more to match your application’s design and monitoring needs. No matter your use case, ECharts lets you shape the gauge itself—not just its container—bringing the same advanced customization capabilities already available in Line Charts to one of the most widely used widgets in Ubidots.